

Evaluators and Executors
premsql evaluators consist of two things. It comes with executors which helps to connect and execute SQL to the DB. PremSQL Text2SQLEvaluator lets you to evaluate your models / pipelines using the executors w.r.t. a gold dataset. Our evaluators supports the following metrics as of now:- Execution Accuracy (EX)
- Valid Efficiency Score (VES)
Execution Accuracy (EX)
Execution Accuracy measures the correctness of the SQL generated by the model by comparing the executed results with the ground truth SQL. This metric gives a direct measure of how accurate the generated SQL is.Valid Efficiency Score (VES)
The primary objective of the SQL queries generated by Large Language Models (LLMs) is accuracy. However, performance is also crucial when dealing with large datasets. The Valid Efficiency Score assesses both accuracy and performance, ensuring that the generated query is optimized for execution. The figure below illustrates how this metric is computed:Evaluation Setup
Let’s dive into the code to see how you can usepremsql to evaluate models or pipelines using these metrics.
Lets setup all the things required for an evaluation. For an evaluation,
we need an evaluation / validation dataset. A generator that will generate and generate and
saves the results. We also need an executor which we will plug in to our evaluator
to execute the SQL queries which will be compared with the ground truth SQL queries.
Lets start with importing the required libraries and setting up our Datasets
and Generators. If you are not familiar with Datasets and Generators, you can checkout out
Datasets and Generators guide.
Output
Output
- metric_name: str
The metric to be evaluated. It can be either
accuracyorves. - model_responses: dict The responses generated by the model.
- filter_by: str The filter to be applied to the responses. It can be any key from the responses.
- meta_time_out: int The time out for the execution of the SQL queries.
filter_by option to filter the results by db_id. This will
not only give you the overall accuracy but also it will divide the distribution of the accuracy
over all the available databases. If you have a key called: difficulty then it will show the result
distribution over different available difficulty. Make sure these keys are available in the dataset, because
if these are available in the dataset then it will be reflected on the model responses and hence on
the results.
Once evaluation is finished it will write three files:
predict.json: This file contains the responses and the evaluation results.accuracy.json: This file contains the accuracy results.ves.json: This file contains the VES results. This will only be written if you have provided the metric_name to beves.
predict.json would look like after evaluation.
db_id.
Step 7: Plotting VES Results
Visualize the results to understand performance across different databases. Such analysis helps identify areas for improvement.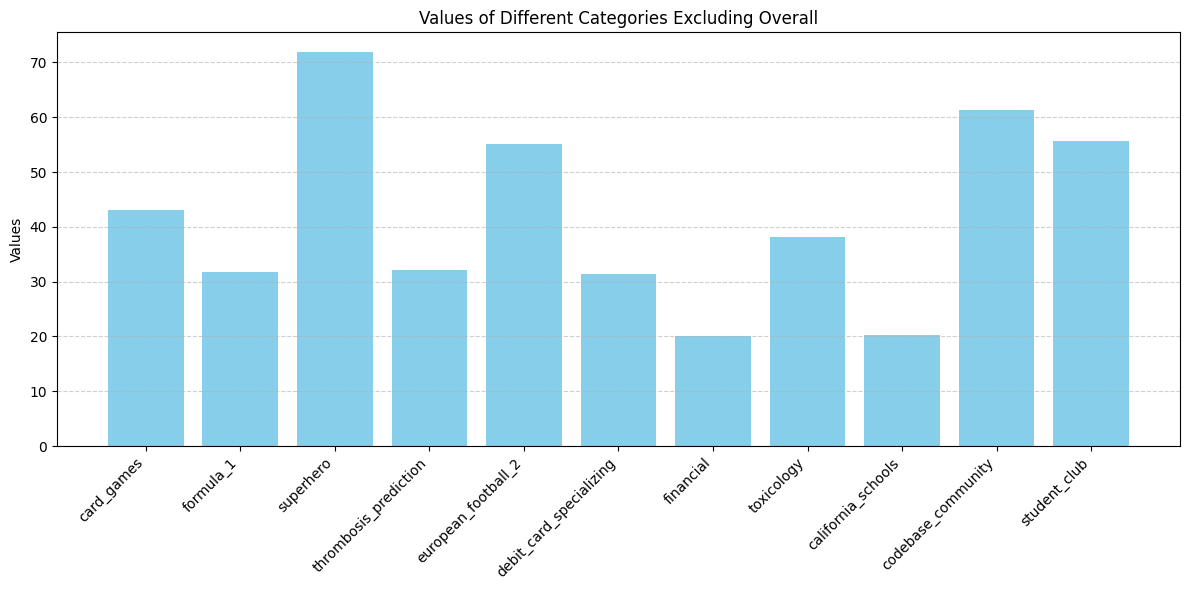
predict.json and the ability to plot graphs plot over different
filters makes it very useful to analyse the results and evaluate the pipelines empirically.